1984 United States Senate elections
| ||||||||||||||||||||||||||||||||||||||||
33 of the 100 seats in the United States Senate 51 seats needed for a majority | ||||||||||||||||||||||||||||||||||||||||
|---|---|---|---|---|---|---|---|---|---|---|---|---|---|---|---|---|---|---|---|---|---|---|---|---|---|---|---|---|---|---|---|---|---|---|---|---|---|---|---|---|
| ||||||||||||||||||||||||||||||||||||||||
 Results of the elections: Democratic gain Republican gain Democratic hold Republican hold No election | ||||||||||||||||||||||||||||||||||||||||
| ||||||||||||||||||||||||||||||||||||||||
The 1984 United States Senate elections were held on November 6, with the 33 seats of Class 2 contested in regular elections. They coincided with the landslide re-election of President Ronald Reagan in the presidential election. In spite of the lopsided presidential race, Reagan's Republican Party suffered a net loss of two Senate seats to the Democrats, although it retained control of the Senate with a reduced 53–47 majority.
Democrats defeated incumbents in Illinois and Iowa, and won an open seat in Tennessee, while Republicans defeated an incumbent in Kentucky. This was the first time since 1972 that Democrats gained Class 2 Senate seats.
Results summary
[edit]| 47 | 53 |
| Democratic | Republican |
| Parties | Total | ||||||||||||||||||||||||||||||||||||||||||||||||||||||||||||||||||||||||||||||||||||||||||||||||||
|---|---|---|---|---|---|---|---|---|---|---|---|---|---|---|---|---|---|---|---|---|---|---|---|---|---|---|---|---|---|---|---|---|---|---|---|---|---|---|---|---|---|---|---|---|---|---|---|---|---|---|---|---|---|---|---|---|---|---|---|---|---|---|---|---|---|---|---|---|---|---|---|---|---|---|---|---|---|---|---|---|---|---|---|---|---|---|---|---|---|---|---|---|---|---|---|---|---|---|---|
| Democratic | Republican | Libertarian | Other | ||||||||||||||||||||||||||||||||||||||||||||||||||||||||||||||||||||||||||||||||||||||||||||||||
| Last elections (1982) | 46 | 54 | 0 | 0 | 100 | ||||||||||||||||||||||||||||||||||||||||||||||||||||||||||||||||||||||||||||||||||||||||||||||
| Before these elections | 45 | 55 | 0 | 0 | 100 | ||||||||||||||||||||||||||||||||||||||||||||||||||||||||||||||||||||||||||||||||||||||||||||||
| Not up | 31 | 36 | — | — | 67 | ||||||||||||||||||||||||||||||||||||||||||||||||||||||||||||||||||||||||||||||||||||||||||||||
| Up Class 2 (1978→1984) |
14 | 19 | — | — | 33 | ||||||||||||||||||||||||||||||||||||||||||||||||||||||||||||||||||||||||||||||||||||||||||||||
| Incumbent retired | 2 | 2 | — | — | 4 | ||||||||||||||||||||||||||||||||||||||||||||||||||||||||||||||||||||||||||||||||||||||||||||||
| Held by same party | 2 | 1 | — | — | 3 | ||||||||||||||||||||||||||||||||||||||||||||||||||||||||||||||||||||||||||||||||||||||||||||||
| Replaced by other party | — | — | 1 | ||||||||||||||||||||||||||||||||||||||||||||||||||||||||||||||||||||||||||||||||||||||||||||||||
| Result | 3 | 1 | — | — | 4 | ||||||||||||||||||||||||||||||||||||||||||||||||||||||||||||||||||||||||||||||||||||||||||||||
| Incumbent ran | 12 | 17 | — | — | 29 | ||||||||||||||||||||||||||||||||||||||||||||||||||||||||||||||||||||||||||||||||||||||||||||||
| Won re-election | 11 | 15 | — | — | 26 | ||||||||||||||||||||||||||||||||||||||||||||||||||||||||||||||||||||||||||||||||||||||||||||||
| Lost re-election | — | — | 3 | ||||||||||||||||||||||||||||||||||||||||||||||||||||||||||||||||||||||||||||||||||||||||||||||||
| Lost renomination, but held by same party |
0 | 0 | — | — | 0 | ||||||||||||||||||||||||||||||||||||||||||||||||||||||||||||||||||||||||||||||||||||||||||||||
| Result | 13 | 16 | — | — | 29 | ||||||||||||||||||||||||||||||||||||||||||||||||||||||||||||||||||||||||||||||||||||||||||||||
| Total elected | 16 | 17 | 0 | 0 | 33 | ||||||||||||||||||||||||||||||||||||||||||||||||||||||||||||||||||||||||||||||||||||||||||||||
| Net gain/loss | 2 | ||||||||||||||||||||||||||||||||||||||||||||||||||||||||||||||||||||||||||||||||||||||||||||||||||
| Nationwide vote | 23,079,278 | 22,850,493 | 160,798 | 232,231 | 46,322,800 | ||||||||||||||||||||||||||||||||||||||||||||||||||||||||||||||||||||||||||||||||||||||||||||||
| Share | 49.82% | 49.33% | 0.35% | 0.50% | 100% | ||||||||||||||||||||||||||||||||||||||||||||||||||||||||||||||||||||||||||||||||||||||||||||||
| Result | 47 | 53 | 0 | 0 | 100 | ||||||||||||||||||||||||||||||||||||||||||||||||||||||||||||||||||||||||||||||||||||||||||||||
Source: Office of the Clerk[1]
Gains, losses, and holds
[edit]Retirements
[edit]Two Republicans and two Democrats retired instead of seeking re-election.
| State | Senator | Replaced by |
|---|---|---|
| Massachusetts | Paul Tsongas | John Kerry |
| Tennessee | Howard Baker | Al Gore |
| Texas | John Tower | Phil Gramm |
| West Virginia | Jennings Randolph | Jay Rockefeller |
Defeats
[edit]Two Republicans and one Democrat sought re-election but lost in the general election.
| State | Senator | Replaced by |
|---|---|---|
| Illinois | Charles H. Percy | Paul Simon |
| Iowa | Roger Jepsen | Tom Harkin |
| Kentucky | Walter Dee Huddleston | Mitch McConnell |
Post-election changes
[edit]| State | Senator | Replaced by |
|---|---|---|
| North Carolina | John Porter East | Jim Broyhill |
Change in composition
[edit]Before the elections
[edit]| D1 | D2 | D3 | D4 | D5 | D6 | D7 | D8 | D9 | D10 |
| D20 | D19 | D18 | D17 | D16 | D15 | D14 | D13 | D12 | D11 |
| D21 | D22 | D23 | D24 | D25 | D26 | D27 | D28 | D29 | D30 |
| D40 Mont. Ran |
D39 Mich. Ran |
D38 Mass. Retired |
D37 La. Ran |
D36 Ky. Ran |
D35 Ga. Ran |
D34 Del. Ran |
D33 Ark. Ran |
D32 Ala. Ran |
D31 |
| D41 Neb. Ran |
D42 N.J. Ran |
D43 Okla. Ran |
D44 R.I. Ran |
D45 W.Va. Retired |
R55 Wyo. Ran |
R54 Va. Ran |
R53 Texas Retired |
R52 Tenn. Retired |
R51 S.Dak. Ran |
| Majority → | |||||||||
| R41 Iowa Ran |
R42 Kan. Ran |
R43 Me. Ran |
R44 Minn. Ran |
R45 Miss. Ran |
R46 N.H. Ran |
R47 N.M. Ran |
R48 N.C. Ran |
R49 Ore. Ran |
R50 S.C. Ran |
| R40 Ill. Ran |
R39 Idaho Ran |
R38 Colo. Ran |
R37 Alaska Ran |
R36 | R35 | R34 | R33 | R32 | R31 |
| R21 | R22 | R23 | R24 | R25 | R26 | R27 | R28 | R29 | R30 |
| R20 | R19 | R18 | R17 | R16 | R15 | R14 | R13 | R12 | R11 |
| R1 | R2 | R3 | R4 | R5 | R6 | R7 | R8 | R9 | R10 |
After the elections
[edit]| D1 | D2 | D3 | D4 | D5 | D6 | D7 | D8 | D9 | D10 |
| D20 | D19 | D18 | D17 | D16 | D15 | D14 | D13 | D12 | D11 |
| D21 | D22 | D23 | D24 | D25 | D26 | D27 | D28 | D29 | D30 |
| D40 Neb. Re-elected |
D39 Mont. Re-elected |
D38 Mich. Re-elected |
D37 Mass. Hold |
D36 La. Re-elected |
D35 Ga. Re-elected |
D34 Del. Re-elected |
D33 Ark. Re-elected |
D32 Ala. Re-elected |
D31 |
| D41 N.J. Re-elected |
D42 Okla. Re-elected |
D43 R.I. Re-elected |
D44 W.Va. Hold |
D45 Ill. Gain |
D46 Iowa Gain |
D47 Tenn. Gain |
R53 Ky. Gain |
R52 Wyo. Re-elected |
R51 Va. Re-elected |
| Majority → | |||||||||
| R41 Me. Re-elected |
R42 Minn. Re-elected |
R43 Miss. Re-elected |
R44 N.H. Re-elected |
R45 N.M. Re-elected |
R46 N.C. Re-elected |
R47 Ore. Re-elected |
R48 S.C. Re-elected |
R49 S.Dak. Re-elected |
R50 Texas Hold |
| R40 Kan. Re-elected |
R39 Idaho Re-elected |
R38 Colo. Re-elected |
R37 Alaska Re-elected |
R36 | R35 | R34 | R33 | R32 | R31 |
| R21 | R22 | R23 | R24 | R25 | R26 | R27 | R28 | R29 | R30 |
| R20 | R19 | R18 | R17 | R16 | R15 | R14 | R13 | R12 | R11 |
| R1 | R2 | R3 | R4 | R5 | R6 | R7 | R8 | R9 | R10 |
| Key |
|
|---|
Race summary
[edit]Special elections
[edit]There were no special elections to the U.S. Senate in 1984.
Elections leading to the next Congress
[edit]In these general elections, the winners were elected for the term beginning January 3, 1985; ordered by state.
All of the elections involved the Class 2 seats.
| State | Incumbent | Result | Candidates | ||
|---|---|---|---|---|---|
| Senator | Party | Electoral history | |||
| Alabama | Howell Heflin | Democratic | 1978 | Incumbent re-elected. |
|
| Alaska | Ted Stevens | Republican | 1968 (appointed) 1970 1972 1978 |
Incumbent re-elected. |
|
| Arkansas | David Pryor | Democratic | 1978 | Incumbent re-elected. |
|
| Colorado | William L. Armstrong | Republican | 1978 | Incumbent re-elected. |
Others
|
| Delaware | Joe Biden | Democratic | 1972 1978 |
Incumbent re-elected. |
|
| Georgia | Sam Nunn | Democratic | 1972 (special) 1972 1978 |
Incumbent re-elected. |
|
| Idaho | Jim McClure | Republican | 1972 1978 |
Incumbent re-elected. |
|
| Illinois | Charles H. Percy | Republican | 1966 1972 1978 |
Incumbent lost re-election. Democratic gain. |
Others
|
| Iowa | Roger Jepsen | Republican | 1978 | Incumbent lost re-election. Democratic gain. |
|
| Kansas | Nancy Kassebaum | Republican | 1978 1978 (appointed) |
Incumbent re-elected. |
Others
|
| Kentucky | Walter Dee Huddleston | Democratic | 1972 1978 |
Incumbent lost re-election. Republican gain. |
|
| Louisiana | J. Bennett Johnston | Democratic | 1972 (appointed) 1972 1978 |
Incumbent re-elected. |
|
| Maine | William Cohen | Republican | 1978 | Incumbent re-elected. |
|
| Massachusetts | Paul Tsongas | Democratic | 1978 | Incumbent retired. Democratic hold. Incumbent resigned January 2, 1985 to give successor preferential seniority. Winner appointed the same day. |
|
| Michigan | Carl Levin | Democratic | 1978 | Incumbent re-elected. |
|
| Minnesota | Rudy Boschwitz | Republican | 1978 1978 (appointed) |
Incumbent re-elected. |
|
| Mississippi | Thad Cochran | Republican | 1978 1978 (appointed) |
Incumbent re-elected. |
|
| Montana | Max Baucus | Democratic | 1978 1978 (appointed) |
Incumbent re-elected. |
|
| Nebraska | J. James Exon | Democratic | 1978 | Incumbent re-elected. |
|
| New Hampshire | Gordon J. Humphrey | Republican | 1978 | Incumbent re-elected. |
|
| New Jersey | Bill Bradley | Democratic | 1978 | Incumbent re-elected. |
|
| New Mexico | Pete Domenici | Republican | 1972 1978 |
Incumbent re-elected. |
|
| North Carolina | Jesse Helms | Republican | 1972 1978 |
Incumbent re-elected. |
|
| Oklahoma | David Boren | Democratic | 1978 | Incumbent re-elected. |
|
| Oregon | Mark Hatfield | Republican | 1966 1972 1978 |
Incumbent re-elected. |
|
| Rhode Island | Claiborne Pell | Democratic | 1960 1966 1972 1978 |
Incumbent re-elected. |
|
| South Carolina | Strom Thurmond | Republican | 1954 (write-in)[a] 1954 (appointed) 1956 (Resigned) 1956 (special) 1960 1966 1972 1978 |
Incumbent re-elected. |
|
| South Dakota | Larry Pressler | Republican | 1978 | Incumbent re-elected. |
|
| Tennessee | Howard Baker | Republican | 1966 1972 1978 |
Incumbent retired. Democratic gain. |
|
| Texas | John Tower | Republican | 1961 (special) 1966 1972 1978 |
Incumbent retired. Republican hold. |
|
| Virginia | John Warner | Republican | 1978 1979 (appointed) |
Incumbent re-elected. |
|
| West Virginia | Jennings Randolph | Democratic | 1958 (special) 1960 1966 1972 1978 |
Incumbent retired. Democratic hold. Winner seated January 15, 1985 to finish term as Governor of West Virginia. |
|
| Wyoming | Alan Simpson | Republican | 1978 1979 (appointed) |
Incumbent re-elected. |
|
Closest races
[edit]In six races the margin of victory was under 10%.
| State | Party of winner | Margin |
|---|---|---|
| Kentucky | Republican (flip) | 0.41% |
| Illinois | Democratic (flip) | 1.86% |
| West Virginia | Democratic | 3.09% |
| North Carolina | Republican | 3.85% |
| Nebraska | Democratic | 3.92% |
| Michigan | Democratic | 4.61% |
Minnesota was the tipping point state with a margin of victory of 16.8%.
Alabama
[edit]
| |||||||||||||||||
| |||||||||||||||||
 County results Heflin: 50–60% 60–70% 70–80% 80–90% Smith: 40–50% 50–60% 60–70% | |||||||||||||||||
| |||||||||||||||||

- 80–90%
- 70–80%
- 60–70%
- 50–60%
- 40–50%
- 30–40%
- 50–60%
- 40–50%
- 30–40%
- 30–40%
The 1984 United States Senate election in Alabama was held on November 6, 1984. Incumbent Democratic Senator Howell Heflin was easily re-elected to a second term. Heflin received 94% of the black vote.[2]
Alaska
[edit]
| |||||||||||||||||
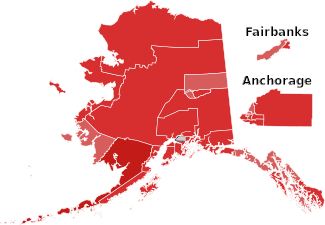 Results by state house district Stevens: 60–70% 70–80% 80–90% | |||||||||||||||||
| |||||||||||||||||
Incumbent Republican Ted Stevens sought re-election to a fourth term. Owing to his popularity and the conservative bent of Alaska, Stevens did not face major opposition, and easily defeated former Alaska Attorney General John Havelock in the general election.
| Party | Candidate | Votes | % | |
|---|---|---|---|---|
| Republican | Ted Stevens (incumbent) | 65,522 | 69.22% | |
| Democratic | John Havelock | 19,074 | 20.15% | |
| Democratic | Dave Carlson | 4,620 | 4.88% | |
| Republican | Michael Beasley | 2,443 | 2.58% | |
| Democratic | Joe Tracanna | 1,661 | 1.75% | |
| Democratic | Phil Stoddard | 1,331 | 1.41% | |
| Total votes | 94,651 | 100.00% | ||
| Party | Candidate | Votes | % | ±% | |
|---|---|---|---|---|---|
| Republican | Ted Stevens (Incumbent) | 146,919 | 71.17% | −4.42% | |
| Democratic | John E. Havelock | 58,804 | 28.49% | +4.39% | |
| Write-ins | 715 | 0.35% | |||
| Majority | 88,115 | 42.68% | −8.81% | ||
| Turnout | 206,438 | ||||
| Republican hold | Swing | ||||
Arkansas
[edit]
| |||||||||||||||||
 County results Pryor: 50–60% 60–70% 70–80% Bethune: 50–60% 60–70% | |||||||||||||||||
| |||||||||||||||||
Incumbent Democrat David Pryor won re-election to a second term over Republican U.S. Representative Ed Bethune.
| Party | Candidate | Votes | % | |
|---|---|---|---|---|
| Democratic | David Pryor (Incumbent) | 502,341 | 57.35% | |
| Republican | Ed Bethune | 373,615 | 42.65% | |
| Majority | 128,726 | 14.70% | ||
| Turnout | 875,956 | |||
| Democratic hold | ||||
Colorado
[edit]
| |||||||||||||||||
| |||||||||||||||||
 County results Armstrong: 40-50% 50–60% 60–70% 70–80% Dick: 50–60% 60–70% | |||||||||||||||||
| |||||||||||||||||
Incumbent Republican William L. Armstrong won re-election to a second term over Democrat Lieutenant Governor of Colorado Nancy E. Dick.
| Party | Candidate | Votes | % | |
|---|---|---|---|---|
| Republican | William L. Armstrong (Incumbent) | 833,821 | 64.25% | |
| Democratic | Nancy Dick | 449,327 | 34.62% | |
| Libertarian | Craig Green | 11,077 | 0.85% | |
| Socialist Workers | David Martin | 2,208 | 0.17% | |
| Prohibition | Earl Higgerson | 1,376 | 0.11% | |
| Majority | 384,494 | 29.63% | ||
| Total votes | 1,297,809 | 100.00% | ||
| Republican hold | ||||
Delaware
[edit]
| |||||||||||||||||
 County results Biden: 50–60% 60–70% | |||||||||||||||||
| |||||||||||||||||
Incumbent Democrat and future President of the United States Joe Biden won re-election to a third term, defeating Republican challenger John M. Burris, former Majority Leader of the Delaware House of Representatives.
| Party | Candidate | Votes | % | ±% | |
|---|---|---|---|---|---|
| Democratic | Joe Biden (Incumbent) | 147,831 | 60.11% | +2.15% | |
| Republican | John M. Burris | 98,101 | 39.89% | −1.13% | |
| Majority | 49,730 | 20.22% | +3.28% | ||
| Turnout | 245,932 | ||||
| Democratic hold | Swing | ||||
Georgia
[edit]
| |||||||||||||||||
 County results Nunn: 60–70% 70–80% 80–90% >90% | |||||||||||||||||
| |||||||||||||||||
Incumbent Democrat Sam Nunn won re-election to a third term over Republican educator, Mike Hicks[5][6]
| Party | Candidate | Votes | % | ±% | |
|---|---|---|---|---|---|
| Democratic | Sam Nunn (Incumbent) | 1,344,104 | 79.94% | −3.19% | |
| Republican | Mike Hicks | 337,196 | 20.06% | +3.19% | |
| Majority | 1,006,908 | 59.88% | −6.39% | ||
| Turnout | 1,681,300 | ||||
| Democratic hold | Swing | ||||
Idaho
[edit]
| |||||||||||||||||
 County Results McClure: 50–60% 60–70% 70–80% 80–90% 90–100% | |||||||||||||||||
| |||||||||||||||||
Incumbent Republican James A. McClure won re-election to a third term over Democratic Vietnam War veteran, Peter M. Busch.
| Party | Candidate | Votes | % | |
|---|---|---|---|---|
| Republican | James A. McClure (Incumbent) | 293,193 | 72.19% | |
| Democratic | Peter M. Busch | 105,591 | 26.00% | |
| Libertarian | Donald B. Billings | 7,384 | 1.82% | |
| Majority | 187,602 | 46.19% | ||
| Total votes | 406,168 | 100.00% | ||
| Republican hold | ||||
Illinois
[edit]
| |||||||||||||||||
 County results Simon: 40–50% 50–60% 60–70% Percy: 40–50% 50–60% 60–70% | |||||||||||||||||
| |||||||||||||||||
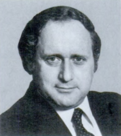
Incumbent Republican Charles H. Percy ran for re-election to a fourth term in the United States Senate. Senator Percy was opposed by Democratic nominee Paul Simon, who was a United States Congressman from Illinois's 22nd congressional district. The campaign between Percy and Simon was brutal and toughly-fought, and ended up with Simon ousting Percy by fewer than 90,000 votes, which was, at the time, considered an upset.
The election was very close. Simon prevailed by only 89,126 votes, or 1.86%. Incumbent Percy did well all throughout the state, including the Chicago collar counties. However, Simon received huge numbers out of the heavily populated and Democratic Cook County, which encompasses most of the Chicago Metropolitan Area. Percy led early on and well into the night, but as Cook County began to count all of its votes, Simon pulled ahead. Simon won despite then-president Reagan winning the state easily. Percy called Simon at around 5 A.M. the next day and conceded. Percy also congratulated Simon on his hard-earned victory. Simon was sworn in on January 3, 1985, and served in the senate until January 3, 1997, when he retired. Simon was later succeeded by Dick Durbin, a close friend and fellow Democrat.
| Party | Candidate | Votes | % | ±% | |
|---|---|---|---|---|---|
| Democratic | Paul Simon | 2,397,165 | 50.07% | +4.60% | |
| Republican | Charles H. Percy (Incumbent) | 2,308,039 | 48.21% | −5.13% | |
| Libertarian | Steve I. Givot | 59,777 | 1.25% | +0.74% | |
| Independent | Marjorie H. Pries | 12,366 | 0.26% | ||
| Socialist Workers | Nelson Gonzalez | 4,913 | 0.10% | −0.40% | |
| Communist | Ishmael Flory | 4,802 | 0.10% | ||
| Write-ins | 273 | 0.01% | |||
| Majority | 89,126 | 1.86% | −6.00% | ||
| Turnout | 4,787,335 | ||||
| Democratic gain from Republican | Swing | ||||
Iowa
[edit]
| |||||||||||||||||
 County results Harkin: 40–50% 50–60% 60–70% Jepsen: 40–50% 50–60% 60–70% 70–80% | |||||||||||||||||
| |||||||||||||||||
Incumbent Republican Roger Jepsen ran for re-election to a second term in the United States Senate. Jepsen was opposed by United States Congressman Tom Harkin, from Iowa's 5th congressional district, who won the Democratic primary uncontested. The general election was full of mudslinging and personal attacks, including the embellishment by both candidates of their military records; Harkin attacked Jepsen for failing to keep his promise to not sell AWACS aircraft to Saudi Arabia.[7] Ultimately, Harkin defeated Jepsen by a wide margin, winning the first of five terms in the Senate.
| Party | Candidate | Votes | % | |
|---|---|---|---|---|
| Democratic | Tom Harkin | 106,005 | 99.93% | |
| Democratic | Write-ins | 70 | 0.07% | |
| Total votes | 106,075 | 100.00% | ||
| Party | Candidate | Votes | % | |
|---|---|---|---|---|
| Republican | Roger Jepsen (Incumbent) | 113,996 | 99.87% | |
| Republican | Write-ins | 147 | 0.13% | |
| Total votes | 114,143 | 100.00% | ||
| Party | Candidate | Votes | % | ±% | |
|---|---|---|---|---|---|
| Democratic | Tom Harkin | 716,883 | 55.46% | +7.54% | |
| Republican | Roger Jepsen (Incumbent) | 564,381 | 43.66% | −7.47% | |
| Independent | Garry De Young | 11,014 | 0.85% | ||
| Write-ins | 422 | 0.03% | |||
| Majority | 152,502 | 11.80% | +8.58% | ||
| Turnout | 1,292,700 | ||||
| Democratic gain from Republican | Swing | ||||
Kansas
[edit]
| |||||||||||||||||
 County Results Kassebaum: 50-60% 60-70% 70-80% 80-90% | |||||||||||||||||
| |||||||||||||||||
Incumbent Republican Nancy Kassebaum won re-election to a second term over Democrat James R. Maher, a financial consultant.
| Party | Candidate | Votes | % | |
|---|---|---|---|---|
| Republican | Nancy Kassebaum (incumbent) | 757,402 | 75.99% | |
| Democratic | James R. Maher | 211,664 | 21.24% | |
| Conservative | Lucille Bieger | 9,380 | 0.94% | |
| American | Marian Ruck Jackson | 6,918 | 0.69% | |
| Libertarian | Douglas N. Merritt | 6,755 | 0.68% | |
| Prohibition | Freda H. Steele | 4,610 | 0.46% | |
| Majority | 545,738 | 54.75% | ||
| Total votes | 996,729 | 100.00% | ||
| Republican hold | ||||
Kentucky
[edit]
| |||||||||||||||||
 County results McConnell: 50–60% 60–70% 70–80% 80–90% Huddleston: 50–60% 60–70% 70–80% 80–90% | |||||||||||||||||
| |||||||||||||||||
Incumbent Democrat Walter Huddleston ran for re-election to a third term, but lost by less than 0.5% to Jefferson County Executive Mitch McConnell.
Huddleston was unopposed in the Democratic Party's primary.
| Party | Candidate | Votes | % | |
|---|---|---|---|---|
| Republican | Mitch McConnell | 39,465 | 79.22% | |
| Republican | C. Roger Harker | 3,798 | 7.62% | |
| Republican | Tommy Klein | 3,352 | 6.73% | |
| Republican | Thurman Jerome Hamlin | 3,202 | 6.43% | |
| Total votes | 49,817 | 100.00% | ||
| Party | Candidate | Votes | % | ±% | |
|---|---|---|---|---|---|
| Republican | Mitch McConnell | 644,990 | 49.90% | +13.03% | |
| Democratic | Walter Huddleston (Incumbent) | 639,721 | 49.50% | −11.48% | |
| Socialist Workers | Dave Welters | 7,696 | 0.60% | ||
| Majority | 5,269 | 0.41% | −23.70% | ||
| Turnout | 1,292,407 | ||||
| Republican gain from Democratic | Swing | ||||
Louisiana
[edit]
| |||||||||||||||||||||
| |||||||||||||||||||||
 Parish results Johnston: 70–80% 80–90% >90% | |||||||||||||||||||||
| |||||||||||||||||||||
Incumbent Democratic J. Bennett Johnston won unopposed to a third term.
| Party | Candidate | Votes | % | |
|---|---|---|---|---|
| Democratic | J. Bennett Johnston (Incumbent) | Unopposed | ||
| Democratic hold | ||||
Maine
[edit]
| |||||||||||||||||
 County results Cohen: 60–70% 70–80% | |||||||||||||||||
| |||||||||||||||||
Incumbent Republican William Cohen won re-election to a second term over Democrat Libby Mitchell, State Representative.
| Party | Candidate | Votes | % | |
|---|---|---|---|---|
| Republican | William Cohen (Incumbent) | 404,414 | 73.34% | |
| Democratic | Libby Mitchell | 142,626 | 25.87% | |
| Constitutionalist | P. Ann Stoddard | 4,338 | 0.79% | |
| Majority | 261,788 | 47.47% | ||
| Turnout | 551,378 | |||
| Republican hold | ||||
Massachusetts
[edit]
| |||||||||||||||||
| |||||||||||||||||
| |||||||||||||||||
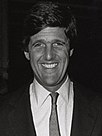
The election was won by Democrat John Kerry, the Lieutenant Governor of Massachusetts who remained Senator until 2013 when he resigned to become U.S. Secretary of State. One-term incumbent Paul Tsongas declined to seek re-election and retired from the Senate following a battle with cancer.
| Party | Candidate | Votes | % | |
|---|---|---|---|---|
| Democratic | John Kerry | 322,470 | 40.83% | |
| Democratic | James Shannon | 297,941 | 37.72% | |
| Democratic | David M. Bartley | 85,910 | 10.88% | |
| Democratic | Michael Connolly | 82,999 | 10.51% | |
| All others | 502 | 0.06% | ||
| Party | Candidate | Votes | % | |
|---|---|---|---|---|
| Republican | Ray Shamie | 173,851 | 62.38% | |
| Republican | Elliot Richardson | 104,761 | 37.59% | |
| All others | 70 | 0.03% | ||
| Party | Candidate | Votes | % | |
|---|---|---|---|---|
| Democratic | John Kerry | 1,393,150 | 55.06% | |
| Republican | Ray Shamie | 1,136,913 | 44.94% | |
| All others | 408 | 0.02% | ||
| Turnout | 2,530,063 | |||
| Majority | 256,237 | 10.12% | ||
| Democratic hold | ||||
Michigan
[edit]
| |||||||||||||||||
 County results Levin: 40–50% 50–60% 60–70% Lousma: 50–60% 60–70% 70–80% | |||||||||||||||||
| |||||||||||||||||
Incumbent Democrat Carl Levin won re-election to a second term.
| Party | Candidate | Votes | % | |
|---|---|---|---|---|
| Democratic | Carl Levin (Incumbent) | 1,915,831 | 51.8% | |
| Republican | Jack Lousma | 1,745,302 | 47.2% | |
| Tisch Citizens | Arthur Richard Tisch | 22,882 | 0.6% | |
| Libertarian | Lynn Johnston | 7,786 | 0.2% | |
| Socialist | Helen Meyers | 2,686 | 0.1% | |
| Workers World | William Roundtree | 2,279 | 0.1% | |
| Independent | Max Dean | 2,135 | 0.1% | |
| Communist | Samuel L. Webb | 1,196 | 0.0% | |
| Workers League | Fred Mazelis | 818 | 0.0% | |
| Turnout | 3,700,915 | |||
| Majority | 170,529 | 4.6% | ||
| Democratic hold | ||||
Minnesota
[edit]
| |||||||||||||||||
 County results
Boschwitz: 50–60% 60–70% 70–80% Growe: 40–50% 50–60% | |||||||||||||||||
| |||||||||||||||||
Incumbent Republican Rudy Boschwitz defeated Democratic challenger Joan Growe, Minnesota Secretary of State.
| Party | Candidate | Votes | % | |
|---|---|---|---|---|
| Republican | Rudy Boschwitz (Incumbent) | 1,199,926 | 58.08% | |
| Democratic | Joan Growe | 852,844 | 41.28% | |
| Socialist Workers | Eleanor Garcia | 5,351 | 0.26% | |
| New Union Party | Jeffrey M. Miller | 4,653 | 0.23% | |
| Libertarian | Richard Putman | 3,129 | 0.15% | |
| Turnout | 2,065,903 | |||
| Majority | 347,082 | 16.8% | ||
| Republican hold | ||||
Mississippi
[edit]
| |||||||||||||||||
 Cochran: 50–60% 60–70% 70–80% Winter: 50–60% 60–70% 70–80% | |||||||||||||||||
| |||||||||||||||||
Incumbent Republican Thad Cochran won re-election to a second term over former Democratic Governor William Winter.
| Party | Candidate | Votes | % | |
|---|---|---|---|---|
| Republican | Thad Cochran (Incumbent) | 580,314 | 60.9% | |
| Democratic | William Winter | 371,926 | 39.1% | |
| Turnout | 952,240 | |||
| Majority | 298,388 | 21.8% | ||
| Republican hold | ||||
Montana
[edit]
| |||||||||||||||||
 County results Baucus: 40–50% 50–60% 60–70% 70–80% Cozzens: 40–50% 50–60% | |||||||||||||||||
| |||||||||||||||||
Incumbent Max Baucus ran for re-election. He easily won renomination in the Democratic primary, and advanced to the general election, where he faced Chuck Cozzens, a former State Representative and the Republican nominee. Despite President Ronald Reagan's strong performance in the state that year, Baucus was able to easily win a second term over Cozzens.
| Party | Candidate | Votes | % | |
|---|---|---|---|---|
| Democratic | Max Baucus (Incumbent) | 80,726 | 79.37% | |
| Democratic | Bob Ripley | 20,979 | 20.63% | |
| Total votes | 101,705 | 100.00% | ||
| Party | Candidate | Votes | % | |
|---|---|---|---|---|
| Republican | Chuck Cozzens | 33,661 | 50.78% | |
| Republican | Ralph Bouma | 17,900 | 27.00% | |
| Republican | Aubyn Curtiss | 14,729 | 22.22% | |
| Total votes | 66,290 | 100.00% | ||
| Party | Candidate | Votes | % | ±% | |
|---|---|---|---|---|---|
| Democratic | Max Baucus (Incumbent) | 215,704 | 56.89% | +1.20% | |
| Republican | Chuck Cozzens | 154,308 | 40.70% | −3.61% | |
| Libertarian | Neil Haprin | 9,143 | 2.41% | ||
| Majority | 61,396 | 16.19% | +4.81% | ||
| Turnout | 379,155 | ||||
| Democratic hold | Swing | ||||
Nebraska
[edit]
| |||||||||||||||||
 County results Exon: 50–60% 60–70% Hoch: 50–60% 60–70% 70–80% | |||||||||||||||||
| |||||||||||||||||
Incumbent Democrat J. James Exon won re-election to a second term over Republican businesswoman Nancy Hoch.
| Party | Candidate | Votes | % | ±% | |
|---|---|---|---|---|---|
| Democratic | J. James Exon (Incumbent) | 332,217 | 51.94% | −15.72% | |
| Republican | Nancy Hoch | 307,147 | 48.02% | +15.67% | |
| Write-ins | 304 | 0.05% | |||
| Majority | 25,070 | 3.92% | −31.40% | ||
| Turnout | 639,668 | ||||
| Democratic hold | Swing | ||||
New Hampshire
[edit]
| |||||||||||||||||
Humphrey: 50–60% 60–70% 70–80% 80–90% >90% D'Amours: 50–60% 60–70% 80–90% >90% | |||||||||||||||||
| |||||||||||||||||
Incumbent Republican Gordon J. Humphrey won re-election to a second term over Democratic U.S. Representative Norman D'Amours.
| Party | Candidate | Votes | % | |
|---|---|---|---|---|
| Republican | Gordon J. Humphrey (Incumbent) | 225,828 | 58.75% | |
| Democratic | Norman D'Amours | 157,447 | 40.96% | |
| Libertarian | Saunder H. Primack | 1,094 | 0.28% | |
| Majority | 67,381 | 17.79% | ||
| Total votes | 384,369 | 100.00% | ||
| Republican hold | ||||
New Jersey
[edit]
| |||||||||||||||||
 County results Bradley: 50–60% 60–70% 70–80% | |||||||||||||||||
| |||||||||||||||||
Incumbent Democrat Bill Bradley ran for re-election to a second term, defeating Republican Mayor of Montclair Mary V. Mochary.
| Party | Candidate | Votes | % | |
|---|---|---|---|---|
| Democratic | Bill Bradley (Incumbent) | 1,986,644 | 64.16% | |
| Republican | Mary V. Mochary | 1,080,100 | 34.88% | |
| Independent | James T. Hagen | 10,409 | 0.34% | |
| Libertarian | Harold F. Leiendecker | 7,135 | 0.23% | |
| Socialist Labor | Jules Levin | 6,053 | 0.20% | |
| Socialist Workers | Priscilla Schenk | 3,224 | 0.10% | |
| Independent | Jasper C. Gould | 2,891 | 0.09% | |
| Majority | 906,544 | 29.28% | ||
| Total votes | 3,096,456 | 100.00% | ||
| Democratic hold | ||||
New Mexico
[edit]
| |||||||||||||||||
 County results Domenici: 50–60% 60–70% 70–80% 80–90% | |||||||||||||||||
| |||||||||||||||||
Incumbent Republican Pete Domenici ran for re-election to a third term, defeating Democrat Judith Pratt.
| Party | Candidate | Votes | % | |
|---|---|---|---|---|
| Democratic | Judith Pratt | 67,722 | 45.50% | |
| Democratic | Nick Franklin | 56,434 | 37.91% | |
| Democratic | Anselmo A. Chavez | 24,694 | 16.59% | |
| Majority | 11,288 | 7.58% | ||
| Total votes | 148,850 | 100.00% | ||
| Party | Candidate | Votes | % | |
|---|---|---|---|---|
| Republican | Pete Domenici (Incumbent) | 361,371 | 71.90% | |
| Democratic | Judith Pratt | 141,253 | 28.10% | |
| N/A | Others | 10 | 0.00% | |
| Majority | 220,118 | 43.79% | ||
| Total votes | 502,634 | 100.00% | ||
| Republican hold | ||||
North Carolina
[edit]
| |||||||||||||||||
 County results Helms: 50– 60% 60–70% 70–80% Hunt: 40–50% 50–60% 60–70% | |||||||||||||||||
| |||||||||||||||||
The election was fought between the Republican incumbent Jesse Helms and Democratic Governor Jim Hunt. Helms won the election, the most expensive non-presidential election in United States history up to that point, by a margin significantly reduced from that that Helms achieved in 1978.
| Party | Candidate | Votes | % | |
|---|---|---|---|---|
| Republican | Jesse Helms | 134,675 | 90.65% | |
| Republican | George Wimbish | 13,799 | 9.35% | |
| Turnout | 148,574 | |||
| Party | Candidate | Votes | % | |
|---|---|---|---|---|
| Democratic | Jim Hunt | 655,429 | 77.48% | |
| Democratic | Thomas Allred | 126,841 | 14.99% | |
| Democratic | Harrill Jones | 63,676 | 7.53% | |
| Turnout | 845,946 | |||
Hunt had a commanding lead in opinion polls for much of the campaign, with one poll in 1983 putting him nineteen points clear of Helms.[19] However, that was changed by the most bitterly contested election in the country that year.[19] Hunt ran a campaign ad connecting Helms to death squads in El Salvador through his association with the Nationalist Republican Alliance, for whom Roberto d'Aubuisson had recently run for the President of El Salvador.[19] In the short time before election day, however, the highly popular incumbent US President Ronald Reagan gave Helms a significant boost[20] by campaigning for him and running a local TV ad praising Helms and asking registered voters in North Carolina to re-elect him.[21]
The election cost a total of $26,379,483 in total reported spending (over twelve times as much as the 1980 race), of which, 64% ($16.9m) was spent by Helms.[22]
| Party | Candidate | Votes | % | |
|---|---|---|---|---|
| Republican | Jesse Helms (Incumbent) | 1,156,768 | 51.7% | |
| Democratic | Jim Hunt | 1,070,488 | 47.8% | |
| Libertarian | Bobby Emory | 9,302 | 0.4% | |
| Socialist Workers | Kate Daher | 2,493 | 0.1% | |
| Turnout | 2,239,051 | |||
| Majority | 86,280 | 3.9% | ||
| Republican hold | ||||
Voters Education Project (VEP) in Atlanta study showed that Helms received 63 percent of the white vote and was particularly successful in small towns and rural areas, while receiving less than 1 percent of the black vote in 35 almost-all-black precincts.[23] "Hunt got 37 percent of the white and 98.8 percent of the black vote, according to VEP. But only 61 percent of registered blacks voted, down from 63 percent in 1980."[23] While, It had among the lowest industrial wages in the United States and was third in terms of mobile homes.[23]
Oklahoma
[edit]Incumbent Democrat David Boren won re-election to a second term.
| |||||||||||||||||
 County results Boren: 60–70% 70–80% 80–90% >90% | |||||||||||||||||
| |||||||||||||||||
| Party | Candidate | Votes | % | |
|---|---|---|---|---|
| Democratic | David Boren (Incumbent) | 906,131 | 75.6% | |
| Republican | Will E. Bill Crozier | 280,638 | 23.4% | |
| Libertarian | Robert T. Murphy | 11,168 | 0.9% | |
| Majority | 625,493 | 52.2% | ||
| Total votes | 1,197,937[24] | 100.00% | ||
| Democratic hold | ||||
Oregon
[edit]
| |||||||||||||||||
 County results Hatfield: 60–70% 70–80% | |||||||||||||||||
| |||||||||||||||||
Incumbent Republican Mark Hatfield sought re-election, defeating Democrat State Senator Margie Hendricksen.
| Party | Candidate | Votes | % | |
|---|---|---|---|---|
| Republican | Mark Hatfield (Incumbent) | 808,152 | 66.53% | |
| Democratic | Margie Hendricksen | 406,122 | 33.43% | |
| Independent Republican | Ralph H. Preston | 461 | 0.04% | |
| Majority | 402,030 | 33.10% | ||
| Total votes | 1,214,735 | 100.00% | ||
| Republican hold | ||||
Rhode Island
[edit]
| |||||||||||||||||
Pell: 50–60% 60–70% 70–80% 80–90% | |||||||||||||||||
| |||||||||||||||||
Incumbent Democrat Claiborne Pell sought re-election, defeating Republican Barbara M. Leonard.
| Party | Candidate | Votes | % | |
|---|---|---|---|---|
| Democratic | Claiborne Pell (Incumbent) | 285,811 | 72.66% | |
| Republican | Barbara Leonard | 107,545 | 27.34% | |
| Majority | 178,266 | 45.32% | ||
| Total votes | 393,356 | 100.00% | ||
| Democratic hold | ||||
South Carolina
[edit]
| |||||||||||||||||
 County results Thurmond: 40–50% 50–60% 60–70% 70–80% 80–90% Purvis: 40–50% | |||||||||||||||||
| |||||||||||||||||
Popular incumbent Republican Strom Thurmond cruised to re-election against Democratic challenger Melvin Purvis. Melvin Purvis, a white minister and the son of famous FBI agent Melvin Purvis, won a close race against black photographer Cecil J. Williams. The closeness of the race and the fact that the black candidate did not win propelled Jesse Jackson to request a Justice Department investigation into the primary and he also considered an independent bid for the seat. Governor Richard Riley and 3rd district Representative Butler Derrick flirted with running, but backed down when Thurmond received endorsements from prominent Democrats in South Carolina.
| Democratic Primary | ||
|---|---|---|
| Candidate | Votes | % |
| Melvin Purvis | 149,730 | 50.2% |
| Cecil J. Williams | 148,586 | 49.8% |
Senator Strom Thurmond easily defeated Robert Cunningham to advance to the general election.
| Republican Primary | ||
|---|---|---|
| Candidate | Votes | % |
| Strom Thurmond | 44,662 | 94.3% |
| Robert H. Cunningham | 2,693 | 5.7% |
Thurmond received endorsements from former Democratic governor Robert Evander McNair, Charleston mayor Joseph P. Riley Jr., and an assortment of black mayors in the state. He did not face a serious challenge and spent almost $1.5 million on the race whereas Purvis spent less than $10,000. An ironic footnote to the election is the fact that Purvis used Thurmond's age as an issue in the campaign. He claimed Thurmond was too old, yet Purvis died less than two years after the election of a heart attack at age 46.
| Party | Candidate | Votes | % | ±% | |
|---|---|---|---|---|---|
| Republican | Strom Thurmond (Incumbent) | 644,814 | 66.8% | +11.2% | |
| Democratic | Melvin Purvis | 306,982 | 31.8% | −12.6% | |
| Libertarian | Stephen Davis | 13,323 | 1.4% | +1.4% | |
| No party | Write-Ins | 335 | 0.0% | 0.0% | |
| Majority | 337,832 | 35.0% | +23.8% | ||
| Turnout | 965,454 | 68.7% | +11.0% | ||
| Republican hold | |||||
South Dakota
[edit]
| |||||||||||||||||
 County Results Pressler: 50-60% 60-70% 70-80% 80–90% >90% Cunningham: 50–60% | |||||||||||||||||
| |||||||||||||||||
Incumbent Republican Larry Pressler won re-election for a second term, defeating Democrat George V. Cunningham.
| Party | Candidate | Votes | % | |
|---|---|---|---|---|
| Republican | Larry Pressler (Incumbent) | 235,176 | 74.49% | |
| Democratic | George V. Cunningham | 80,537 | 25.51% | |
| Majority | 154,639 | 43.79% | ||
| Total votes | 315,713 | 100.00% | ||
| Republican hold | ||||
Tennessee
[edit]
| |||||||||||||||||||||
| |||||||||||||||||||||
 County results Gore: 50–60% 60–70% 70–80% 80–90% Ashe: 50–60% 60–70% 70–80% | |||||||||||||||||||||
| |||||||||||||||||||||
Three-term popular incumbent Howard Baker, who had served as United States Senate Majority Leader since 1981 (Minority Leader from 1977 to 1981) decided not to seek re-election in order to concentrate on a planned bid for 1988 Republican presidential nomination (which did not happen, as he later accepted a White House Chief of Staff position under President Ronald Reagan). This made a seat open.
Democrats nominated Representative and future Vice President of the United States Al Gore, whose father Albert Gore, Sr. once held the other Tennessee Senate seat.
| Party | Candidate | Votes | % | |
|---|---|---|---|---|
| Democratic | Al Gore | 476,582 | 100.00% | |
| Total votes | 476,582 | 100.00% | ||
In the Republican primary, held on August 2, state Senator Victor Ashe easily emerged as a winner.
| Party | Candidate | Votes | % | |
|---|---|---|---|---|
| Republican | Victor Ashe | 145,744 | 86.47% | |
| Republican | Jack McNeil | 17,970 | 10.66% | |
| Republican | Herbert David Patty | 4,777 | 2.83% | |
| Republican | Write-in | 49 | 0.03% | |
| Total votes | 168,540 | 100% | ||
Although the Senate election coincided with the landslide re-election of President Reagan, who carried Tennessee by a wide margin, this time his victory did not have any coattails, as it did in 1980, and Democrats picked up three Republican seats. One of the Democratic gains was in Tennessee, where moderate democrat Gore won in a landslide:[26]
| Party | Candidate | Votes | % | |
|---|---|---|---|---|
| Democratic | Al Gore | 1,000,607 | 60.72% | |
| Republican | Victor Ashe | 557,016 | 33.80% | |
| Independent | Ed McAteer | 87,234 | 5.29% | |
| Independent | Khalil-Ullah Al-Muhaymin | 3,179 | 0.19% | |
| Turnout | 1,640,836 | |||
| Majority | 443,591 | 26.92% | ||
| Democratic gain from Republican | ||||
Texas
[edit]
| |||||||||||||||||
 County results Gramm: 50–60% 60–70% 70–80% 80–90% Doggett: 50–60% 60–70% 70–80% 80–90% | |||||||||||||||||
| |||||||||||||||||
Incumbent Republican John G. Tower decided to retire, instead of seeking a fifth term. Republican Phil Gramm won the open seat over Democratic State Senator Lloyd Doggett.
The Democratic primary was 45% Hispanic, but included many moderate to conservative voters. Hance positioned himself as the most moderate to conservative candidate, who co-sponsored President Ronald Reagan's tax package.[27] Doggett was the more liberal candidate, attacking Reaganomics and getting endorsements from the Texas teachers' union and Agriculture Commissioner Jim Hightower.[28] Krueger was seen as the front runner and was a moderate who supported the state's oil and gas industry, but had close ties with the Hispanic community because he was Spanish-speaking.[29] Hance attacked both Kroeger and Doggett for supporting amnesty for illegal aliens and supporting gay rights.[30] The initial primary was extremely close between the top three candidates. Each candidate got 31% of the electorate. Hance ranked first, only 273 votes ahead of Doggett and 1,560 votes ahead of Krueger.
Since no candidate passed the 50% threshold, Hance and Doggett qualified for the run-off election. Hance fired his pollster despite ranking first.[31] Krueger endorsed fellow U.S. Congressman Hance, saying "Ultimately, the quality of one's public service depends upon the character that one displays in filling an office."[32][33] In the June election, Doggett very narrowly defeated Hance by just 1,345 votes.
Initial election on May 5, 1984
| Party | Candidate | Votes | % | |
|---|---|---|---|---|
| Democratic | Kent Hance | 456,446 | 31.2% | |
| Democratic | Lloyd Doggett | 456,173 | 31.2% | |
| Democratic | Bob Krueger | 454,886 | 31.1% | |
| Democratic | David Young | 47,062 | 3.2% | |
| Democratic | Robert S. Sullivan | 34,733 | 2.4% | |
| Democratic | Harley Schlanger | 14,149 | 1.0% | |
Run-off election on June 2, 1984
| Party | Candidate | Votes | % | |
|---|---|---|---|---|
| Democratic | Lloyd Doggett | 491,251 | 50.1% | |
| Democratic | Kent Hance | 489,906 | 49.9% | |
The Republican primary was a highly competitive, multimillion-dollar contest.[36] Gramm recently switched parties in 1983, but he was a conservative who supported Reaganomics. Gramm spent $4 million.[37]
| Party | Candidate | Votes | % | |
|---|---|---|---|---|
| Republican | Phil Gramm | 247,280 | 73.3% | |
| Republican | Ron Paul | 55,771 | 16.5% | |
| Republican | Robert Mosbacher Jr. | 26,250 | 7.8% | |
| Republican | Hank Grover | 8,055 | 2.5% | |
| Party | Candidate | Votes | % | |
|---|---|---|---|---|
| Republican | Phil Gramm | 3,111,348 | 58.6% | |
| Democratic | Lloyd Doggett | 2,202,557 | 41.4% | |
| Turnout | 5,313,905 | |||
| Majority | 908,791 | 17.2% | ||
| Republican hold | ||||
Virginia
[edit]| Turnout | 52.4% (voting eligible)[40] | ||||||||||||||||
|---|---|---|---|---|---|---|---|---|---|---|---|---|---|---|---|---|---|
| |||||||||||||||||
 County and independent city results Warner: 50–60% 60–70% 70–80% 80–90% Harrison: 50–60% | |||||||||||||||||
| |||||||||||||||||
Incumbent Republican John W. Warner won re-election to a second term. He handily defeated Edythe C. Harrison, member of the Virginia House of Delegates[41] the "first woman in Virginia nominated by the Democratic Party for statewide office."[42]
| Party | Candidate | Votes | % | ±% | |
|---|---|---|---|---|---|
| Republican | John Warner (Incumbent) | 1,406,194 | 70.05% | +19.88% | |
| Democratic | Edythe C. Harrison | 601,142 | 29.95% | −19.84% | |
| Write-ins | 151 | 0.01% | −0.03% | ||
| Majority | 805,052 | 40.10% | +39.71% | ||
| Turnout | 2,007,487 | ||||
| Republican hold | |||||
West Virginia
[edit]
| |||||||||||||||||
 County results Rockefeller: 40–50% 50–60% 60–70% 70–80% Raese: 50–60% 60–70% 70-80% | |||||||||||||||||
| |||||||||||||||||
Incumbent Democratic Jennings Randolph decided to retire, instead of seeking a fifth term. Democrat Jay Rockefeller won the open seat over Republican John Raese.
| Party | Candidate | Votes | % | |
|---|---|---|---|---|
| Democratic | Jay Rockefeller | 374,233 | 51.82% | |
| Republican | John Raese | 344,680 | 47.73% | |
| Socialist Workers | Mary E. 'Joan' Radin | 3,299 | 0.46% | |
| Majority | 29,553 | 3.09% | ||
| Total votes | 722,212 | 100.00% | ||
| Democratic hold | ||||
Wyoming
[edit]
| |||||||||||||||||
 County Results Simpson: 60-70% 70-80% 80–90% | |||||||||||||||||
| |||||||||||||||||
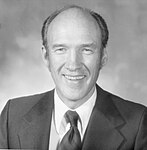
Incumbent Republican Alan K. Simpson has won re-election for a second term, defeating Democrat Victor A. Ryan.
| Party | Candidate | Votes | % | |
|---|---|---|---|---|
| Republican | Alan K. Simpson (Incumbent) | 146,373 | 78.32% | |
| Democratic | Victor A. Ryan | 40,525 | 21.68% | |
| Majority | 105,848 | 43.79% | ||
| Total votes | 186,898 | 100.00% | ||
| Republican hold | ||||
See also
[edit]Notes
[edit]- ^ Senator Strom Thurmond was originally elected as a Democrat in 1954, but as a write-in candidate, a special election in 1956 and 1960 before switching to a Republican in 1964. Thurmond won re-election as a Republican in 1966, 1972 and 1978.
References
[edit]- ^ a b c d e f g h i j k l m n o p q r s t Clerk of the United States House of Representatives (May 1, 1985). "Statistics of the Presidential and Congressional Election of November 6, 1984" (PDF). U.S. Government Printing Office.
- ^ Black, Earl; Black, Merle (1992). The Vital South: How Presidents Are Elected. Harvard University Press. p. 356. ISBN 0674941306.
- ^ "Official Returns By Election Precinct: Primary Election August 28, 1984" (PDF). State of Alaska. Archived from the original (PDF) on October 17, 2012. Retrieved September 26, 2017.
- ^ "General Election Results" (PDF). Archived from the original (PDF) on February 11, 2017. Retrieved September 26, 2017.
- ^ [1][dead link]
- ^ a b "1984 Senatorial General Election Results - Georgia". Archived from the original on June 4, 2011.
- ^ "Down and Dirty - News - The Harvard Crimson". www.thecrimson.com. Retrieved December 20, 2017.
- ^ a b Odell, Mary Jane (June 5, 1984). "Summary of Official Canvass of Votes Cast in Iowa Primary election" (PDF). Retrieved January 24, 2022.
- ^ "Kentucky State Board of Elections Welcome to the State Board of Elections". Elect.ky.gov. Archived from the original on November 13, 2010. Retrieved April 4, 2015.
- ^ "Our Campaigns - MA US Senate - D Primary Race - Sep 18, 1984". www.ourcampaigns.com. Retrieved December 20, 2017.
- ^ "Our Campaigns - MA US Senate - R Primary Race - Sep 18, 1984". www.ourcampaigns.com. Retrieved December 20, 2017.
- ^ Parker, Randy; Reporting for Duty (April 9, 2005). "Our Campaigns: MI U.S. Senate". Our Campaigns.
- ^ "Our Campaigns - MN US Senate Race - Nov 06, 1984". www.ourcampaigns.com. Retrieved December 20, 2017.
- ^ "Our Campaigns - MS US Senate Race - Nov 05, 1996". www.ourcampaigns.com. Retrieved December 20, 2017.
- ^ a b "Report of the Official Canvass of the Vote Cast at the Primary Election Held in the State of Montana, June 5, 1984" (PDF). Montana Secretary of State. Archived from the original (PDF) on June 15, 2013. Retrieved July 2, 2014.
- ^ "NM US Senate - D Primary". OurCampaigns. Retrieved March 16, 2014.
- ^ "NM US Senate". OurCampaigns. Retrieved March 16, 2014.
- ^ a b c "North Carolina DataNet #46" (PDF). University of North Carolina. April 2008. Archived from the original (PDF) on July 25, 2008. Retrieved June 12, 2009.
- ^ a b c Joseph N., Boyce; Lamar, Jacob V. (September 24, 1984). "The Old South vs. the New". Time. Archived from the original on October 29, 2010. Retrieved June 10, 2009.
- ^ http://www.unctv.org/U.S[permanent dead link]. Senatorno/peopleevents/events1.html
- ^ Kenneth Salt (February 1, 2009). "Ronald Reagan ad for Jesse Helms during 1984 election". Retrieved December 20, 2017 – via YouTube.[dead YouTube link]
- ^ "North Carolina DataNet #25" (PDF). University of North Carolina. Archived from the original (PDF) on July 25, 2008. Retrieved June 12, 2009.
- ^ a b c Bill Peterson (November 18, 1984), "Jesse Helms' Lesson for Washington", The Washington Post, retrieved January 16, 2017
- ^ "1984 Oklahoma Election Results" (PDF). Oklahoma State Election Board. 1984. Archived from the original (PDF) on January 25, 2020. Retrieved November 4, 2018.
- ^ "TN US Senate- R Primary Race - Aug 02, 1984". Our Campaigns. Retrieved March 19, 2022.
- ^ "Our Campaigns - TN US Senate Race - Nov 06, 1984". www.ourcampaigns.com. Retrieved December 20, 2017.
- ^ "Conservative Holds Lead in Texas Senate Primary". The New York Times. June 3, 1984. Retrieved December 20, 2017.
- ^ "The Victoria Advocate - Google News Archive Search". google.com.
- ^ "Kentucky New Era - Google News Archive Search". google.com.
- ^ "Mid Cities Daily News - Google News Archive Search". google.com.
- ^ "The Bonham Daily Favorite - Google News Archive Search". google.com.
- ^ AP (June 1, 1984). "CAMPAIGN ; Krueger Backs Hance In Democratic Runoff". The New York Times. Retrieved December 20, 2017.
- ^ "The Victoria Advocate - Google News Archive Search". google.com.
- ^ "Our Campaigns - TX US Senate - D Primary Race - May 05, 1984". ourcampaigns.com.
- ^ "Our Campaigns - TX US Senate - D Runoff Race - Jun 02, 1984". ourcampaigns.com.
- ^ "Daily Times - Google News Archive Search". google.com.
- ^ "The Victoria Advocate - Google News Archive Search". google.com.
- ^ "Gramm Voices Surprise". The Victoria Advocate. May 6, 1984.
- ^ "Our Campaigns - TX US Senate Race - Nov 06, 1990". ourcampaigns.com.
- ^ Dr. Michael McDonald (March 25, 2013). "Turnout 1980-2012". George Mason University. Archived from the original on October 30, 2012. Retrieved April 3, 2013.
- ^ Virginia Women in History,
- ^ "Edythe C. Harrison Papers, 1961-1993 - Special Collections and University Archives". www.lib.odu.edu. Retrieved December 20, 2017.
- ^ "1984 Senatorial General Election Results - Virginia". Archived from the original on May 31, 2013.
Sources
[edit]- Barone, Michael; Ujifusa, Grant (1985). The Almanac of American Politics 1986: The Senators, the Representatives and the Governors: Their Records and Election Results, Their States and Districts.
- Snider, William D. (1985). Helms and Hunt: The North Carolina Senate Race, 1984. University of North Carolina Press.
- State Election Commission (1985). Report of the South Carolina State Election Commission 1984-1985. Columbia, SC: State Election Commission. p. 62.
- Bass, Jack; Marilyn W. Thompson (1998). Ol' Strom: An Unauthorized Biography of Strom Thurmond. Longstreet. p. 302.


