
Red Deer (federal electoral district)
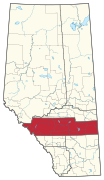
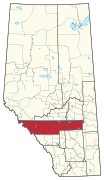
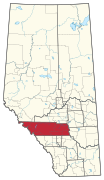
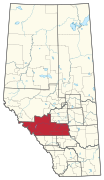
 Red Deer in relation to the other Alberta federal electoral districts (2003 map) | |
| Defunct federal electoral district | |
| Legislature | House of Commons |
| District created | 1907 |
| District abolished | 2013 |
| First contested | 1908 |
| Last contested | 2011 |
| District webpage | profile, map |
| Demographics | |
| Population (2011)[1] | 134,312 |
| Electors (2011) | 91,201 |
| Area (km²)[2] | 4,103.13 |
| Census division(s) | Division No. 8 |
| Census subdivision(s) | Red Deer, Red Deer County, Sylvan Lake, Innisfail |
Red Deer was a federal electoral district in Alberta, Canada, that was represented in the House of Commons of Canada from 1908 to 2015.
History[edit]
This riding was created in 1907 from Calgary and Strathcona ridings. At the time this was a vast riding taking in much of Central Alberta between the two major cities of Calgary and Edmonton. The only major urban centre was Red Deer, then a small town of only 1,500 people.
Once an overwhelmingly rural constituency, it has been consistently reduced in geographic size over the years due to Red Deer's continued growth. In 2003, about 20% of the district was transferred to the Wetaskiwin riding.
The riding was represented by centre-right MPs from 1935 onward. Like most other Alberta ridings outside Calgary and Edmonton, the major right-wing party of the day usually won here by blowout margins. A centre-left candidate last cleared 20 percent of the vote in 1968, and from 1979 onward centre-left candidates were usually lucky to get 15 percent of the vote.
The riding was split almost in half for the 2015 election. The southern portion, including downtown, became Red Deer—Mountain View, while the northern portion was merged with Wetaskiwin to form Red Deer—Lacombe.
Historical boundaries[edit]
-
 1905 representation order
 -
 1914 representation order
 -
 1924 representation order
 -
 1933 representation order
 -
 1952 representation order
 -
 1966 representation order
 -
 1976 representation order
 -
 1987 representation order
 -
 1996 representation order
 -
 2003 representation order


Members of Parliament[edit]
This riding elected the following members of Parliament:
| Parliament | Years | Member | Party | |
|---|---|---|---|---|
| Red Deer Riding created from Calgary and Strathcona |
||||
| 11th | 1908–1911 | Michael Clark | Liberal | |
| 12th | 1911–1917 | |||
| 13th | 1917–1920 | Government (Unionist) | ||
| 1920–1921 | Progressive | |||
| 14th | 1921–1925 | Alfred Speakman | United Farmers | |
| 15th | 1925–1926 | |||
| 16th | 1926–1930 | |||
| 17th | 1930–1935 | |||
| 18th | 1935–1940 | Eric Joseph Poole | Social Credit | |
| 19th | 1940–1945 | Frederick Davis Shaw | ||
| 20th | 1945–1949 | |||
| 21st | 1949–1953 | |||
| 22nd | 1953–1957 | |||
| 23rd | 1957–1958 | |||
| 24th | 1958–1962 | Harris George Rogers | Progressive Conservative | |
| 25th | 1962–1963 | Robert N. Thompson | Social Credit | |
| 26th | 1963–1965 | |||
| 27th | 1965–1968 | |||
| 28th | 1968–1972 | Progressive Conservative | ||
| 29th | 1972–1974 | Gordon Towers | ||
| 30th | 1974–1979 | |||
| 31st | 1979–1980 | |||
| 32nd | 1980–1984 | |||
| 33rd | 1984–1988 | |||
| 34th | 1988–1993 | Douglas Fee | ||
| 35th | 1993–1997 | Bob Mills | Reform | |
| 36th | 1997–2000 | |||
| 2000–2000 | Alliance | |||
| 37th | 2000–2003 | |||
| 2003–2004 | Conservative | |||
| 38th | 2004–2006 | |||
| 39th | 2006–2008 | |||
| 40th | 2008–2011 | Earl Dreeshen | ||
| 41st | 2011–2015 | |||
| Riding dissolved into Red Deer—Mountain View and Red Deer—Lacombe | ||||
Current member of Parliament[edit]
Its member of Parliament is Earl Dreeshen, a farmer and a teacher. He was first elected in 2008. He is a member of the Conservative Party of Canada.
Election results[edit]
| 2011 Canadian federal election | ||||||||
|---|---|---|---|---|---|---|---|---|
| Party | Candidate | Votes | % | ±% | Expenditures | |||
| Conservative | Earl Dreeshen | 37,959 | 75.93 | +2.70 | $63,247 | |||
| New Democratic | Stuart Somerville | 7,566 | 15.13 | +4.03 | $1 | |||
| Green | Mason Sisson | 2,551 | 5.10 | -4.24 | ||||
| Liberal | Andrew Lineker | 1,918 | 3.84 | -2.47 | $3,784 | |||
| Total valid votes/Expense limit | 49,994 | 100.00 | ||||||
| Total rejected ballots | 119 | 0.24 | -0.02 | |||||
| Turnout | 50,113 | 54.01 | +4.14 | |||||
| Eligible voters | 92,792 | – | – | |||||
| 2008 Canadian federal election | ||||||||
|---|---|---|---|---|---|---|---|---|
| Party | Candidate | Votes | % | ±% | Expenditures | |||
| Conservative | Earl Dreeshen | 33,226 | 73.23 | -2.51 | $53,804 | |||
| New Democratic | Stuart Somerville | 5,040 | 11.10 | +1.17 | $1,774 | |||
| Green | Evan Bedford | 4,239 | 9.34 | +4.18 | ||||
| Liberal | Garfield Marks | 2,863 | 6.31 | -2.84 | $7,450 | |||
| Total valid votes/Expense limit | 45,368 | 100.00 | $92,848 | |||||
| Total rejected ballots | 118 | 0.26 | +0.04 | |||||
| Turnout | 45,486 | 49.87 | -14.86 | |||||
| 2006 Canadian federal election | ||||||||
|---|---|---|---|---|---|---|---|---|
| Party | Candidate | Votes | % | ±% | Expenditures | |||
| Conservative | Bob Mills | 38,375 | 75.74 | +0.9 | $58,967 | |||
| New Democratic | Kelly Bickford | 5,034 | 9.93 | +2.1 | $3,014 | |||
| Liberal | Luke Kurata | 4,636 | 9.15 | -2.6 | $11,215 | |||
| Green | Tanner Wade Waldo | 2,618 | 5.16 | +0.4 | $116 | |||
| Total valid votes | 50,663 | 100.00 | ||||||
| Total rejected ballots | 113 | 0.22 | -0.1 | |||||
| Turnout | 50,776 | 58.73 | +1.0 | |||||
| 2004 Canadian federal election | ||||||||
|---|---|---|---|---|---|---|---|---|
| Party | Candidate | Votes | % | ±% | Expenditures | |||
| Conservative | Bob Mills | 33,510 | 74.8 | -7.8 | $51,607 | |||
| Liberal | Luke Kurata | 5,294 | 11.8 | -1.0 | $22,405 | |||
| New Democratic | Jeff Sloychuk | 3,500 | 7.8 | +3.2 | $4,160 | |||
| Green | Garfield John Marks | 2,142 | 4.8 | – | $730 | |||
| Canadian Action | Teena Cormack | 353 | 0.8 | – | $6.75 | |||
| Total valid votes | 44,799 | 100.0 | ||||||
| Total rejected ballots | 117 | 0.3 | +0.1 | |||||
| Turnout | 44,916 | 57.7 | -2.7 | |||||
Note: Conservative vote is compared to the total of Progressive Conservative and Canadian Alliance vote in 2000.
| 2000 Canadian federal election | ||||||||
|---|---|---|---|---|---|---|---|---|
| Party | Candidate | Votes | % | ±% | Expenditures | |||
| Alliance | Bob Mills | 36,940 | 72.6 | +4.2 | $59,079 | |||
| Liberal | Walter Kubanek | 6,522 | 12.8 | +1.4 | $16,550 | |||
| Progressive Conservative | Doug Wagstaff | 5,064 | 10.0 | -5.7 | $5,125 | |||
| New Democratic | Linda Roth | 2,346 | 4.6 | +0.7 | $1,773 | |||
| Total valid votes | 50,872 | 100.0 | ||||||
| Total rejected ballots | 113 | 0.2 | 0.0 | |||||
| Turnout | 50,985 | 60.4 | +3.0 | |||||
Note: Canadian Alliance vote is compared to the Reform vote in 1997.
| 1997 Canadian federal election | ||||||||
|---|---|---|---|---|---|---|---|---|
| Party | Candidate | Votes | % | ±% | Expenditures | |||
| Reform | Bob Mills | 28,622 | 68.4 | +4.0 | $66,815 | |||
| Progressive Conservative | Morris Flewwelling | 6,566 | 15.7 | -0.6 | $44,412 | |||
| Liberal | Dobie To | 4,785 | 11.4 | -2.5 | $13,071 | |||
| New Democratic | Janet Walter | 1,660 | 4.0 | +1.5 | $3,066 | |||
| Natural Law | Kenneth Arnold | 227 | 0.6 | -0.0 | ||||
| Total valid votes | 41,860 | 100.0 | ||||||
| Total rejected ballots | 69 | 0.2 | ||||||
| Turnout | 41,929 | 57.44 | ||||||
| 1993 Canadian federal election | ||||||||
|---|---|---|---|---|---|---|---|---|
| Party | Candidate | Votes | % | ±% | ||||
| Reform | Bob Mills | 31,652 | 64.3 | +43.3 | ||||
| Progressive Conservative | Doug Fee | 8,011 | 16.3 | -37.0 | ||||
| Liberal | Dobie To | 6,838 | 13.9 | +3.8 | ||||
| New Democratic | Karen McLaren | 1,334 | 2.7 | -9.9 | ||||
| National | Joan Hepburn | 1,063 | +2.2 | |||||
| Natural Law | Ken Arnold | 297 | +0.6 | |||||
| Total valid votes | 49,195 | 100.0 | ||||||
| 1988 Canadian federal election | ||||||||
|---|---|---|---|---|---|---|---|---|
| Party | Candidate | Votes | % | ±% | ||||
| Progressive Conservative | Doug Fee | 24,187 | 53.3 | -22.2 | ||||
| Reform | Michael Roth | 9,560 | 21.1 | |||||
| New Democratic | Gail Garbutt | 5,717 | 12.6 | +3.2 | ||||
| Liberal | Edna C. Allwright | 4,593 | 10.1 | +0.7 | ||||
| Christian Heritage | Jim Swan | 1,237 | 2.7 | |||||
| Confederation of Regions | Wilfred M. Tricker | 121 | 0.3 | -4.2 | ||||
| Total valid votes | 45,415 | 100.0 | ||||||
| 1984 Canadian federal election | ||||||||
|---|---|---|---|---|---|---|---|---|
| Party | Candidate | Votes | % | ±% | ||||
| Progressive Conservative | Gordon Towers | 41,695 | 75.4 | +0.7 | ||||
| New Democratic | Clarence Lacombe | 5,201 | 9.4 | +1.5 | ||||
| Liberal | Dennis Moffat | 5,195 | 9.4 | -5.1 | ||||
| Confederation of Regions | Roger Langrick | 2,494 | 4.5 | |||||
| Social Credit | Jim Keegstra | 691 | 1.3 | -1.6 | ||||
| Total valid votes | 55,276 | 100.0 | ||||||
| 1980 Canadian federal election | ||||||||
|---|---|---|---|---|---|---|---|---|
| Party | Candidate | Votes | % | ±% | ||||
| Progressive Conservative | Gordon Towers | 31,758 | 74.7 | -0.1 | ||||
| Liberal | Dennis Moffat | 6,180 | 14.5 | +0.3 | ||||
| New Democratic | Ethel Taylor | 3,345 | 7.9 | +1.4 | ||||
| Social Credit | Cecil J. Speirs | 1,203 | 2.8 | -1.6 | ||||
| Total valid votes | 42,486 | 100.0 | ||||||
| 1979 Canadian federal election | ||||||||
|---|---|---|---|---|---|---|---|---|
| Party | Candidate | Votes | % | ±% | ||||
| Progressive Conservative | Gordon Towers | 33,226 | 74.8 | +8.1 | ||||
| Liberal | Dennis Moffat | 6,338 | 14.3 | -2.6 | ||||
| New Democratic | John Younie | 2,856 | 6.4 | -1.9 | ||||
| Social Credit | Cec Speirs | 1,974 | 4.4 | -3.6 | ||||
| Total valid votes | 44,394 | 100.0 | ||||||
| 1974 Canadian federal election | ||||||||
|---|---|---|---|---|---|---|---|---|
| Party | Candidate | Votes | % | ±% | ||||
| Progressive Conservative | Gordon Towers | 22,251 | 66.7 | +5.4 | ||||
| Liberal | Dennis Moffat | 5,645 | 16.9 | +0.1 | ||||
| New Democratic | Ethel Taylor | 2,791 | 8.4 | -2.9 | ||||
| Social Credit | Jim Keegstra | 2,670 | 8.0 | -2.6 | ||||
| Total valid votes | 33,357 | 100.0 | ||||||
| 1972 Canadian federal election | ||||||||
|---|---|---|---|---|---|---|---|---|
| Party | Candidate | Votes | % | ±% | ||||
| Progressive Conservative | Gordon Towers | 20,943 | 61.3 | -1.0 | ||||
| Liberal | Dennis Moffat | 5,762 | 16.9 | -12.8 | ||||
| New Democratic | Bill Finn | 3,852 | 11.3 | +3.1 | ||||
| Social Credit | Jim Keegstra | 3,631 | 10.6 | |||||
| Total valid votes | 34,188 | 100.0 | ||||||
| 1968 Canadian federal election | ||||||||
|---|---|---|---|---|---|---|---|---|
| Party | Candidate | Votes | % | ±% | ||||
| Progressive Conservative | Robert N. Thompson | 17,930 | 62.2 | +22.4 | ||||
| Liberal | Douglas M. Irwin | 8,541 | 29.6 | |||||
| New Democratic | Peter G. Anderson | 2,349 | 8.2 | +3.0 | ||||
| Total valid votes | 28,820 | 100.0 | ||||||
| 1965 Canadian federal election | ||||||||
|---|---|---|---|---|---|---|---|---|
| Party | Candidate | Votes | % | ±% | ||||
| Social Credit | Robert N. Thompson | 12,383 | 47.1 | +2.2 | ||||
| Progressive Conservative | Gordon Towers | 10,448 | 39.8 | -1.3 | ||||
| Liberal | Max DeHamel | 2,093 | 8.0 | -2.0 | ||||
| New Democratic | Hazel Eva Braithwaite | 1,340 | 5.1 | +1.1 | ||||
| Total valid votes | 26,264 | 100.0 | ||||||
| 1963 Canadian federal election | ||||||||
|---|---|---|---|---|---|---|---|---|
| Party | Candidate | Votes | % | ±% | ||||
| Social Credit | Robert N. Thompson | 12,182 | 44.9 | -6.1 | ||||
| Progressive Conservative | Gordon Towers | 11,149 | 41.1 | +3.4 | ||||
| Liberal | Max DeHamel | 2,702 | 10.0 | +3.5 | ||||
| New Democratic | Paul A. Jenson | 1,082 | 4.0 | -0.8 | ||||
| Total valid votes | 27,115 | 100.0 | ||||||
| 1962 Canadian federal election | ||||||||
|---|---|---|---|---|---|---|---|---|
| Party | Candidate | Votes | % | ±% | ||||
| Social Credit | Robert N. Thompson | 12,645 | 51.0 | +17.6 | ||||
| Progressive Conservative | Harris George Rogers | 9,343 | 37.7 | -16.8 | ||||
| Liberal | Knut E. Magnusson | 1,608 | 6.5 | -0.8 | ||||
| New Democratic | Paul A. Jenson | 1,181 | 4.8 | -0.1 | ||||
| Total valid votes | 24,777 | 100.0 | ||||||
Note: NDP vote is compared to CCF vote in 1958 election.
| 1958 Canadian federal election | ||||||||
|---|---|---|---|---|---|---|---|---|
| Party | Candidate | Votes | % | ±% | ||||
| Progressive Conservative | Harris George Rogers | 11,569 | 54.5 | +24.9 | ||||
| Social Credit | Frederick Davis Shaw | 7,087 | 33.4 | -14.2 | ||||
| Liberal | Sadie A. Shrader | 1,537 | 7.2 | -10.1 | ||||
| Co-operative Commonwealth | Robert H. Carlyle | 1,029 | 4.8 | -0.5 | ||||
| Total valid votes | 21,222 | 100.0 | ||||||
| 1957 Canadian federal election | ||||||||
|---|---|---|---|---|---|---|---|---|
| Party | Candidate | Votes | % | ±% | ||||
| Social Credit | Frederick Davis Shaw | 9,519 | 47.6 | -4.7 | ||||
| Progressive Conservative | Harris Rogers | 5,918 | 29.6 | +20.8 | ||||
| Liberal | Wilfred James Edgar | 3,471 | 17.4 | -12.9 | ||||
| Co-operative Commonwealth | Alexander Sandy Manson | 1,073 | 5.4 | -1.4 | ||||
| Total valid votes | 19,981 | 100.0 | ||||||
| 1953 Canadian federal election | ||||||||
|---|---|---|---|---|---|---|---|---|
| Party | Candidate | Votes | % | ±% | ||||
| Social Credit | Frederick Davis Shaw | 8,792 | 52.4 | -2.1 | ||||
| Liberal | Archie Boyce | 5,076 | 30.2 | +11.6 | ||||
| Progressive Conservative | John A.R. Choate | 1,474 | 8.8 | -9.2 | ||||
| Co-operative Commonwealth | Hubert M. Smith | 1,136 | 6.8 | -2.1 | ||||
| Labor–Progressive | Rose Sarman | 306 | 1.8 | |||||
| Total valid votes | 16,784 | 100.0 | ||||||
| 1949 Canadian federal election | ||||||||
|---|---|---|---|---|---|---|---|---|
| Party | Candidate | Votes | % | ±% | ||||
| Social Credit | Frederick Davis Shaw | 10,549 | 54.5 | +8.0 | ||||
| Liberal | Albert Bliss McGorman | 3,604 | 18.6 | +4.3 | ||||
| Progressive Conservative | Harry Lloyd Taggart | 3,488 | 18.0 | -1.5 | ||||
| Co-operative Commonwealth | Cyril M. Ironside | 1,710 | – | |||||
| Total valid votes | 19,351 | 100.0 | ||||||
| 1945 Canadian federal election | ||||||||
|---|---|---|---|---|---|---|---|---|
| Party | Candidate | Votes | % | ±% | ||||
| Social Credit | Frederick Davis Shaw | 8,653 | 46.5 | +9.7 | ||||
| Progressive Conservative | Harry Lloyd Taggart | 3,636 | 19.5 | +1.8 | ||||
| Co-operative Commonwealth | Alban MacLellan | 2,984 | 16.0 | -2.2 | ||||
| Liberal | Claude J. Davidson | 2,666 | 14.3 | -12.9 | ||||
| Labor–Progressive | William Lund | 677 | 677 | 3.6 | ||||
| Total valid votes | 18,616 | 100.0 | ||||||
Note: Progressive Conservative vote is compared to "National Government" vote in 1940 election.
| 1940 Canadian federal election | ||||||||
|---|---|---|---|---|---|---|---|---|
| Party | Candidate | Votes | % | ±% | ||||
| Social Credit | Frederick Davis Shaw | 5,583 | 36.8 | -22.8 | ||||
| Liberal | Absalom Clark Bury | 4,134 | 27.2 | +13.2 | ||||
| Co-operative Commonwealth | Peter Morrison | 2,771 | 18.3 | +4.3 | ||||
| National Government | Arthur A. Stonhouse | 2,694 | 17.7 | +5.3 | ||||
| Total valid votes | 15,182 | 100.0 | ||||||
Note: "National Government" vote is compared to Conservative vote in 1935 election.
| 1935 Canadian federal election | ||||||||
|---|---|---|---|---|---|---|---|---|
| Party | Candidate | Votes | % | ±% | ||||
| Social Credit | Eric Joseph Poole | 7,901 | 59.6 | |||||
| Liberal | George Clark | 1,861 | 14.0 | -28.2 | ||||
| Co-operative Commonwealth | Alfred Speakman | 1,855 | 14.0 | |||||
| Conservative | Arthur Hiram Stewart | 1,648 | 12.4 | |||||
| Total valid votes | 13,265 | 100.0 | ||||||
| 1930 Canadian federal election | ||||||||
|---|---|---|---|---|---|---|---|---|
| Party | Candidate | Votes | % | ±% | ||||
| United Farmers of Alberta | Alfred Speakman | 6,256 | 57.8 | -14.5 | ||||
| Liberal | William John Botterill | 4,571 | 42.2 | |||||
| Total valid votes | 10,827 | 100.0 | ||||||
| 1926 Canadian federal election | ||||||||
|---|---|---|---|---|---|---|---|---|
| Party | Candidate | Votes | % | ±% | ||||
| United Farmers of Alberta | Alfred Speakman | 5,603 | 72.3 | +26.1 | ||||
| Conservative | Joseph George La France | 2,151 | 27.7 | +3.4 | ||||
| Total valid votes | 7,754 | 100.0 | ||||||
| 1925 Canadian federal election | ||||||||
|---|---|---|---|---|---|---|---|---|
| Party | Candidate | Votes | % | ±% | ||||
| United Farmers of Alberta | Alfred Speakman | 3,851 | 46.2 | -22.9 | ||||
| Liberal | Thomas McKercher | 2,462 | 29.5 | +15.5 | ||||
| Conservative | Joseph George La France | 2,029 | 24.3 | +7.5 | ||||
| Total valid votes | 8,342 | 100.0 | ||||||
| 1921 Canadian federal election | ||||||||
|---|---|---|---|---|---|---|---|---|
| Party | Candidate | Votes | % | ±% | ||||
| United Farmers of Alberta | Alfred Speakman | 10,849 | 69.1 | |||||
| Conservative | John Frederick Day | 2,644 | 16.8 | -41.1 | ||||
| Liberal | William Wallace Burns McInnes | 2,207 | 14.1 | -21.4 | ||||
| Total valid votes | 15,700 | 100.0 | ||||||
Note: Conservative vote is compared to Unionist vote in 1917 election.
| 1917 Canadian federal election | ||||||||
|---|---|---|---|---|---|---|---|---|
| Party | Candidate | Votes | % | ±% | ||||
| Government (Unionist) | Michael Clark | 6,213 | 58.0 | 21.3 | ||||
| Opposition (Laurier Liberals) | William Puffer | 3,800 | 35.5 | -27.9 | ||||
| Labour | Joseph Robert Knight | 701 | 6.5 | |||||
| Total valid votes | 10,714 | 100.0 | ||||||
Note: Unionist vote is compared to Liberal-Conservative vote in 1911 election.
| 1911 Canadian federal election | ||||||||
|---|---|---|---|---|---|---|---|---|
| Party | Candidate | Votes | % | ±% | ||||
| Liberal | Michael Clark | 6,711 | 63.4 | +11.4 | ||||
| Conservative | Alexander McGillivray | 3,882 | 36.6 | -11.4 | ||||
| Total valid votes | 10,593 | 100.0 | ||||||
| 1908 Canadian federal election | ||||||||
|---|---|---|---|---|---|---|---|---|
| Party | Candidate | Votes | % | |||||
| Liberal | Michael Clark | 3,481 | 51.9 | |||||
| Conservative | George F. Root | 3,221 | 48.1 | |||||
| Total valid votes | 6,702 | 100.0 | ||||||
See also[edit]
References[edit]
- "Red Deer (federal electoral district) (Code 48023) Census Profile". 2011 census. Government of Canada - Statistics Canada. Retrieved 2011-03-06.
Notes[edit]
- ^ Statistics Canada: 2012
- ^ Statistics Canada: 2012
External links[edit]
- Riding history for Red Deer from the Library of Parliament
- Expenditures - 2008
- Expenditures - 2004
- Expenditures - 2000
- Expenditures - 1997
- Elections Canada
- Website of the Parliament of Canada