
Dillingham Census Area, Alaska
Dillingham Census Area | |
|---|---|
.jpg) | |
 Location within the U.S. state of Alaska | |
.svg) Alaska's location within the U.S. | |
| Coordinates: 59°57′N 158°26′W / 59.95°N 158.43°W | |
| Country | |
| State | |
| Established | 1980[1] |
| Largest city | Dillingham |
| Area | |
| • Total | 20,915 sq mi (54,170 km2) |
| • Land | 18,569 sq mi (48,090 km2) |
| • Water | 2,346 sq mi (6,080 km2) 11.2% |
| Population (2020) | |
| • Total | 4,723 |
| • Density | 0.26/sq mi (0.10/km2) |
| Time zone | UTC−9 (Alaska) |
| • Summer (DST) | UTC−8 (ADT) |
| Congressional district | At-large |
Dillingham Census Area is a census area located in the state of Alaska, United States. At the 2020 census, the population was 4,857,[2] slightly up from 4,847 in 2010.[3] It is part of the unorganized borough and therefore has no borough seat. Its largest community by far is the city of Dillingham, on a small arm of Bristol Bay on the Bering Sea.
Geography[edit]
According to the U.S. Census Bureau, the census area has a total area of 20,915 square miles (54,170 km2), of which 18,569 square miles (48,090 km2) is land and 2,346 square miles (6,080 km2) (11.2%) is water.[4]
Adjacent boroughs and census areas[edit]
- Bethel Census Area, Alaska - west/north
- Bristol Bay Borough, Alaska
- Lake and Peninsula Borough, Alaska - east
National protected areas[edit]
- Alaska Maritime National Wildlife Refuge (part of the Bering Sea unit)
- Togiak National Wildlife Refuge (part)
- Togiak Wilderness (part)
Demographics[edit]
| Census | Pop. | Note | %± |
|---|---|---|---|
| 1960 | 4,024 | — | |
| 1970 | 3,485 | −13.4% | |
| 1980 | 4,616 | 32.5% | |
| 1990 | 4,012 | −13.1% | |
| 2000 | 4,922 | 22.7% | |
| 2010 | 4,847 | −1.5% | |
| 2020 | 4,857 | 0.2% | |
| 2023 (est.) | 4,607 | [5] | −5.1% |
| U.S. Decennial Census[6] 1790-1960[7] 1900-1990[8] 1990-2000[9] 2010-2020[3] | |||
At the 2000 census there were 4,922 people, 1,529 households, and 1,105 families living in the census area. The population density was 0 people per square mile (0 people/km2). There were 2,332 housing units at an average density of 0 per square mile (0/km2). The racial makeup of the census area was 21.64% White, 0.37% Black or African American, 70.13% Native American, 0.61% Asian, 0.02% Pacific Islander, 0.55% from other races, and 6.68% from two or more races. 2.26% of the population were Hispanic or Latino of any race. 34.6% reported speaking Yupik or Eskimo at home [1].[10] Of the 1,529 households 45.30% had children under the age of 18 living with them, 51.10% were married couples living together, 15.00% had a female householder with no husband present, and 27.70% were non-families. 23.30% of households were one person and 3.60% were one person aged 65 or older. The average household size was 3.20 and the average family size was 3.84.
The age distribution was 38.10% under the age of 18, 7.70% from 18 to 24, 28.90% from 25 to 44, 19.50% from 45 to 64, and 5.70% 65 or older. The median age was 29 years. For every 100 females, there were 109.00 males. For every 100 females age 18 and over, there were 108.80 males. The per capita income is estimated at 23,500 U.S. dollars per year.
Politics[edit]
| Year | Republican | Democratic | Third party | |||
|---|---|---|---|---|---|---|
| No. | % | No. | % | No. | % | |
| 2020 | 822 | 43.10% | 984 | 51.60% | 101 | 5.30% |
| 2016 | 660 | 34.59% | 992 | 51.99% | 256 | 13.42% |
| 2012 | 592 | 36.12% | 967 | 59.00% | 80 | 4.88% |
| 2008 | 1,084 | 54.66% | 851 | 42.91% | 48 | 2.42% |
| 2004 | 797 | 58.47% | 521 | 38.22% | 45 | 3.30% |
| 2000 | 891 | 53.90% | 592 | 35.81% | 170 | 10.28% |
| 1996 | 544 | 39.00% | 643 | 46.09% | 208 | 14.91% |
| 1992 | 707 | 45.67% | 535 | 34.56% | 306 | 19.77% |
| 1988 | 800 | 58.18% | 520 | 37.82% | 55 | 4.00% |
| 1984 | 1,055 | 66.98% | 461 | 29.27% | 59 | 3.75% |
| 1980 | 378 | 36.84% | 477 | 46.49% | 171 | 16.67% |
| 1976 | 512 | 53.39% | 411 | 42.86% | 36 | 3.75% |
| 1972 | 365 | 51.63% | 312 | 44.13% | 30 | 4.24% |
| 1968 | 340 | 49.93% | 320 | 46.99% | 21 | 3.08% |
| 1964 | 156 | 23.18% | 517 | 76.82% | 0 | 0.00% |
| 1960 | 192 | 41.03% | 276 | 58.97% | 0 | 0.00% |
Communities[edit]
.jpg)
Cities[edit]
Census-designated places[edit]
See also[edit]
References[edit]
- ^ In 1980, the United States Census Bureau divided the Unorganized Borough into 12 census areas.
- ^ "2020 Census Data - Cities and Census Designated Places" (Web). State of Alaska, Department of Labor and Workforce Development. Retrieved October 31, 2021.
- ^ a b "State & County QuickFacts". United States Census Bureau. Archived from the original on August 9, 2014. Retrieved May 18, 2014.
- ^ "US Gazetteer files: 2010, 2000, and 1990". United States Census Bureau. February 12, 2011. Retrieved April 23, 2011.
- ^ "Annual Estimates of the Resident Population for Counties: April 1, 2020 to July 1, 2023". United States Census Bureau. Retrieved March 28, 2024.
- ^ "U.S. Decennial Census". United States Census Bureau. Retrieved May 18, 2014.
- ^ "Historical Census Browser". University of Virginia Library. Retrieved May 18, 2014.
- ^ "Population of Counties by Decennial Census: 1900 to 1990". United States Census Bureau. Retrieved May 18, 2014.
- ^ "Census 2000 PHC-T-4. Ranking Tables for Counties: 1990 and 2000" (PDF). United States Census Bureau. Archived (PDF) from the original on October 9, 2022. Retrieved May 18, 2014.
- ^ "U.S. Census website". United States Census Bureau. Retrieved May 14, 2011.
- ^ Elections, RRH (February 2, 2018). "RRH Elections". rrhelections.com. Retrieved January 12, 2020.
External links[edit]
 Definitions from Wiktionary
 Media from Commons
 News from Wikinews
 Quotations from Wikiquote
 Texts from Wikisource
 Textbooks from Wikibooks
 Resources from Wikiversity
Places adjacent to Dillingham Census Area, Alaska | ||||||||||||||||
|---|---|---|---|---|---|---|---|---|---|---|---|---|---|---|---|---|
| ||||||||||||||||
Municipalities and communities of Dillingham Census Area, Alaska, United States | ||
|---|---|---|
| Cities | 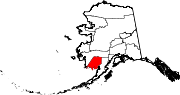 | |
| CDPs | ||
| Unincorporated communities | ||
| Ghost towns | ||

59°57′N 158°26′W / 59.95°N 158.43°W
| International | |
|---|---|
| National | |